How a “trivial” change yielded a 13× throughput increase.
We recently released an open-source Clojure implementation of Roughtime, a protocol for secure time synchronization with cryptographic proof.
When a client asks for the time, it sends a random nonce. The server replies with a signed certificate containing both the nonce and a timestamp, proving the response happened after the request. Responses can be chained together with provable ordering; if any server’s timestamps are inconsistent with that ordering, that server is cryptographically “outed” as unreliable.
The Heavy Lifting
A single request to our server triggers a surprising amount of work:
1. Queueing
An incoming request goes through basic validation and enters a “received queue.” This queue is processed by a batcher, which sends batches to one of four worker queues. When a worker queue picks up a batch, it decodes each request, groups them into sub-batches by version number, and responds to each sub-batch. These go into a sender queue which un-batches and sends the responses back to the requesting server.
2. Protocol Compatibility
We support the entire evolution of the protocol: from Google’s original specification, through all fifteen IETF drafts – that’s sixteen versions. That means we have conditional logic littered throughout the codebase: version tags, padding schemes, tag labels, hash sizes, and packet layouts all vary with the protocol version. In several places, compatibility won over elegance or optimization.
3. Recursive Merkle Trees
Each batch is rolled into a Merkle tree using SHA-512. That means recursive hashing all the way to the root; this is pure CPU-bound work.
4. Ed25519 Signatures
Finally, each response is signed with Ed25519. Public-key signatures are notoriously expensive and are usually the dominant cost in systems like this.
The “Sluggish” Server
Given all that complexity, along with the fact that I’m using a high-level dynamic programming language, I wasn’t surprised when my initial benchmarks showed the server responding in 200 microseconds (µs).
I ran a profiler expecting to see SHA-512 or Ed25519 dominating.
Instead, nearly 90% of the runtime was attributed to the most mundane line in the entire library:
(defn encode-rt-message [msg-map]
  (let [sorted-entries (sort-tags msg-map)
        tag-bytes      (mapv #(tag/tag->bytes (key %)) sorted-entries)
        val-bytes      (mapv #(tag/pad4 (val %)) sorted-entries)

        ;; THE BOTTLENECK:
        val-lens       (mapv alength val-bytes)

        ...]
This line is arguably the most trivial part of the entire codebase. It iterates over 5(ish) byte arrays and asks: “How long are you?”
That’s it.
Yet this one line accounted for almost the entire request time.
The Fix
I wrapped alength in an anonymous function, so that I could include a type hint:
;; BEFORE (~31µs)
(mapv alength val-bytes)

;; AFTER (~4µs)
(mapv (fn [^bytes v] (alength v)) val-bytes)
I profiled the code with and without the type hint. The encoding time dropped from 31µs to 4µs.
Why was (mapv alength ...) so Slow?
Clojure emitted no reflection warnings when I ran my tests; the code is perfectly legal.
But mapv is a higher-order function. It receives alength as a generic IFn object and calls invoke() on it for every item. This means that:
- The compiler cannot inline the operation because the function is passed as a value.
alengthitself must perform a runtime check (RT.alength) to ensure the argument is an array.- Finally, it calls
java.lang.reflect.Array.getLength
The overhead of dynamic dispatch, runtime type checking, and reflection adds up in a tight loop!
By contrast, once I wrote:
(fn [^bytes v] (alength v))the compiler had enough static information to emit a single arraylength bytecode instruction. We replaced a complex chain of method calls with a single JVM bytecode.
End-to-End Benchmark
To verify the impact, I ran a full end-to-end benchmark using Criterium’s quick-benchmark.
Test conditions:
- Apple M2
- 4 parallel workers
- Merkle batch size: 64
- Full crypto enabled (SHA-512 + Ed25519)
Results:
| test | responses/sec | µs/response/core |
|---|---|---|
| Without Type Hint | 19,959 | 200.4 |
| With Type Hint | 264,316 | 15.1 |
That’s a 13× throughput increase from one type hint.
If you plot the comparison, it is striking:
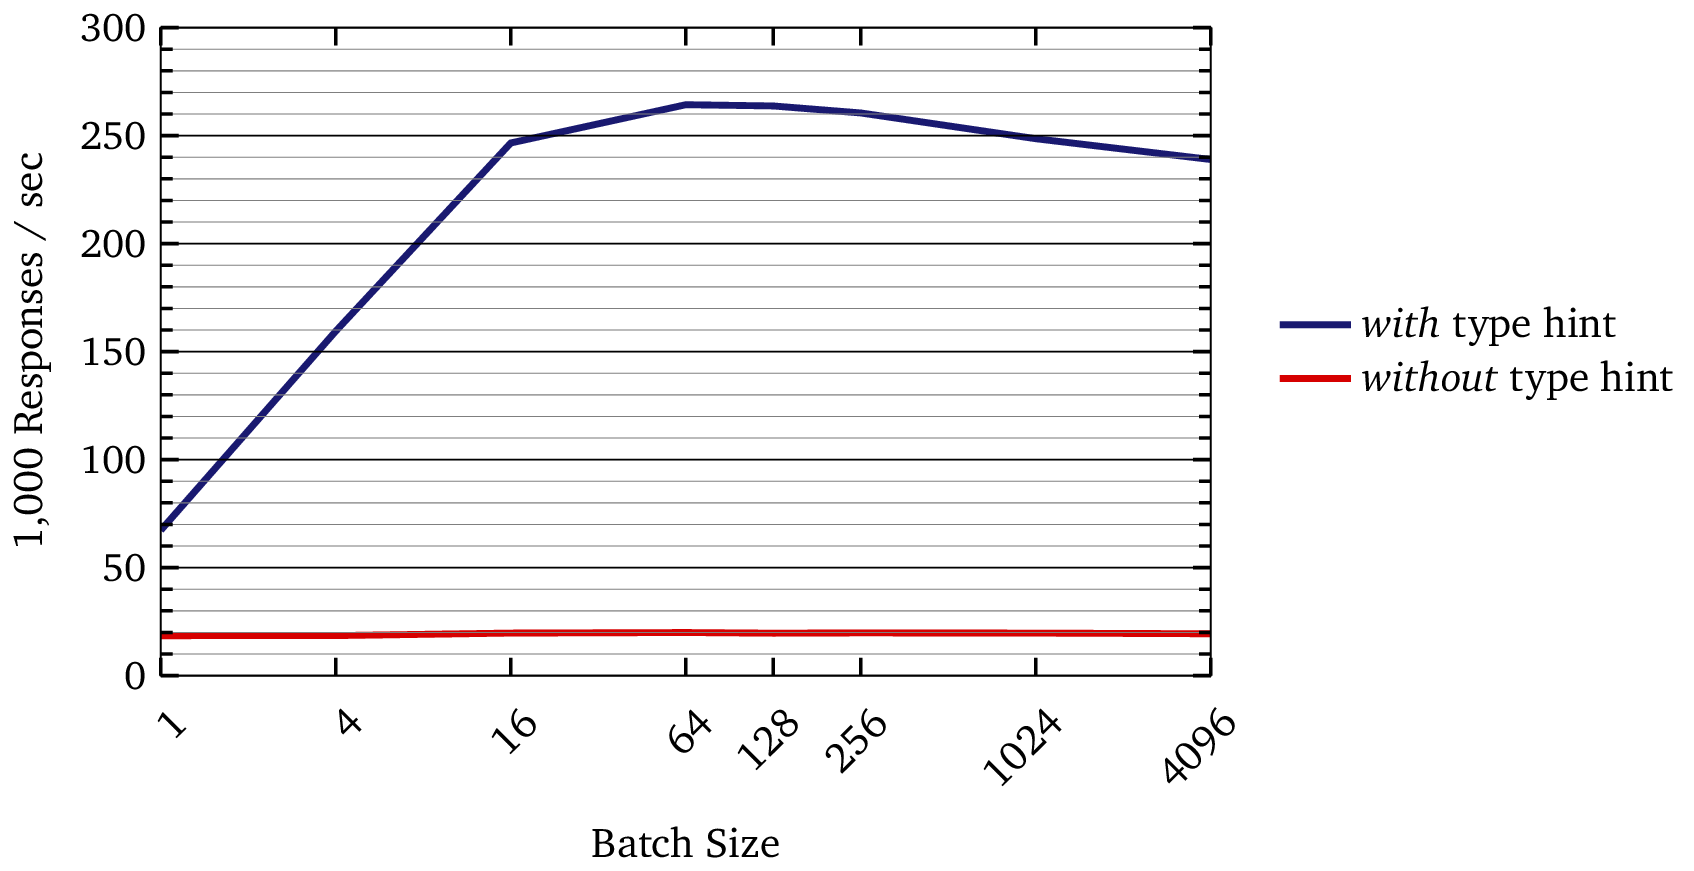
Why Did the Speedup Get Larger?
In isolated tests, the improvement was ~8×. Amdahl’s law suggests that, in the real system, we should see a substantially lower improvement. Instead, we saw the improvement grow to ~13×.
I can’t explain this fully, but my working hypothesis is contention in the reflective call path. When multiple workers hit the same reflective, non-inlinable call site, the JVM cannot optimize it effectively. Removing that reflective barrier allows the JIT to inline and parallelize cleanly.
The result: better scaling under load.
The Lesson
I learned that, when optimizing Clojure code, “no reflection warnings” is not always the end of the story. When you pass low-level primitives through higher-order interfaces, you may accidentally force the runtime back onto generic (and slower) paths. The compiler needs enough information to emit primitive bytecode.
In this case, the code I thought was complex – the crypto, Merkle trees, and protocol gymnastics – was fine. It was the “trivial” line that killed performance.
Without a profiler, I would never, ever, have suspected it.